

Schedule Management


Project Schedule: What It Is & How to Create One [2026]
A project schedule sets the planned dates for every activity. What it includes, how to create one, the schedule baseline, and how it is tested on the PMP.


Gantt Chart: Definition, Example & How to Make One [2026]
A Gantt chart is a bar chart of a project schedule over time. See a clear example, the key elements, how to make and read one, and its benefits and limitations.


Project Milestones: Definition, Examples & Chart [2026]
Project milestones explained: what they are, examples by phase, milestone vs. task vs. deliverable, the milestone chart, and how they are tested on the PMP.
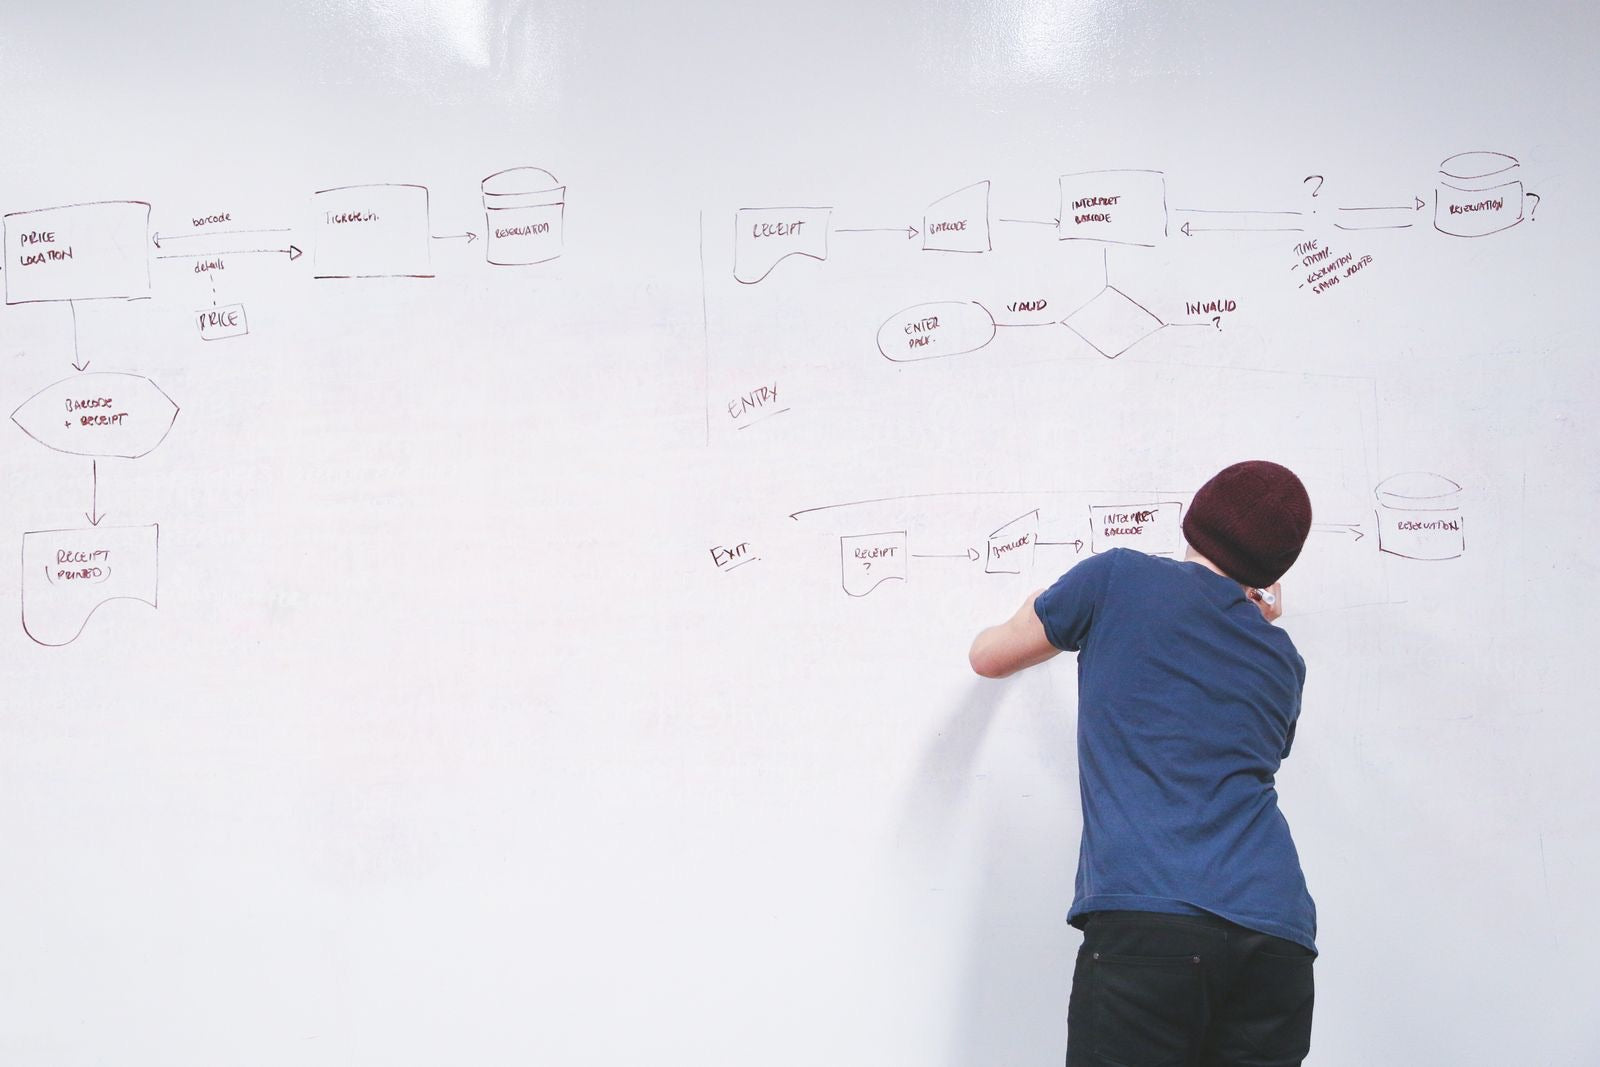

Project Network Diagram: Types & How to Draw One [2026]
A project network diagram maps activities and their dependencies to reveal the critical path. What it is, activity-on-node vs arrow, and how to build one.


Precedence Diagramming Method (PDM): The 4 Types [2026]
The precedence diagramming method (PDM) builds a project network from four dependency types: finish-to-start, start-to-start, finish-to-finish, start-to-finish.


Project Dependencies: Types & How to Manage Them [2026]
Project dependencies link activities so one constrains another. The four logical types and the four categories: mandatory, discretionary, internal, external.


Critical Path Method (CPM): Steps & Example [2026]
The critical path method finds the longest path of tasks that sets your project duration. How to calculate it, a worked example, float, and the PMP exam.

Total Float vs. Free Float: Formulas & Examples [2026]
Total float vs free float, explained: what each one protects, the two formulas, a clear worked example, and how both are tested on the PMP and CAPM exams.


Project Estimation Techniques: 5 Methods Explained [2026]
The five core project estimation techniques — analogous, parametric, bottom-up, three-point, and expert judgment — how each works and when to use each.


PERT Chart: Formula, Examples & How to Use It [2026]
A PERT chart maps a project's activities to plan a schedule under uncertainty. What it is, the three-point formula, how to build one, and PERT vs Gantt.


Analogous Estimating: Definition, Examples & Uses [2026]
Analogous estimating forecasts a project's cost or duration from a similar past project. How it works, an example, analogous vs parametric, and its limits.


Parametric Estimating: Formula, Examples & Uses [2026]
Parametric estimating forecasts cost or duration by multiplying a unit rate by a quantity. The formula, worked examples, parametric vs analogous, and limits.


Bottom-Up Estimating: Definition, Steps & Example [2026]
Bottom-up estimating sums every work package for the most accurate cost or duration. How it works, a worked example, bottom-up vs top-down, and its limits.


Fast-Tracking vs. Crashing: Schedule Compression [2026]
Fast-tracking vs crashing, the two schedule compression techniques: what each is, how they differ, when to use which, and how both are tested on the PMP exam.


Resource Leveling vs. Smoothing: Guide & Examples [2026]
Resource leveling explained: what it is, how it works, and how it differs from resource smoothing — including the effect on the critical path and the PMP exam.


Monte Carlo Simulation in Project Management [2026]
Monte Carlo simulation in project management: how it works, reading the S-curve and P50/P80 values, when to use it, and how it is tested on the PMP exam.